Statistic Chart
Overview
Portal offers statistic chart widgets designed to provide deeper insights into tasks, cases, and overall productivity with visual analytics.
Chart Category |
Available Metrics |
|---|---|
Task Statistics |
By priority, expiry dates, due today, open tasks |
Case Statistics |
Running cases, completed per day, new per day |
Performance Metrics |
Average runtime by category, top priority analysis |
HowTo: Add Statistic Widgets to Dashboard
To add statistic charts to your dashboard:
Navigate to Dashboard Configuration for the desired dashboard
Click Add Widget
From the Statistic Widgets dropdown menu, choose from the available charts
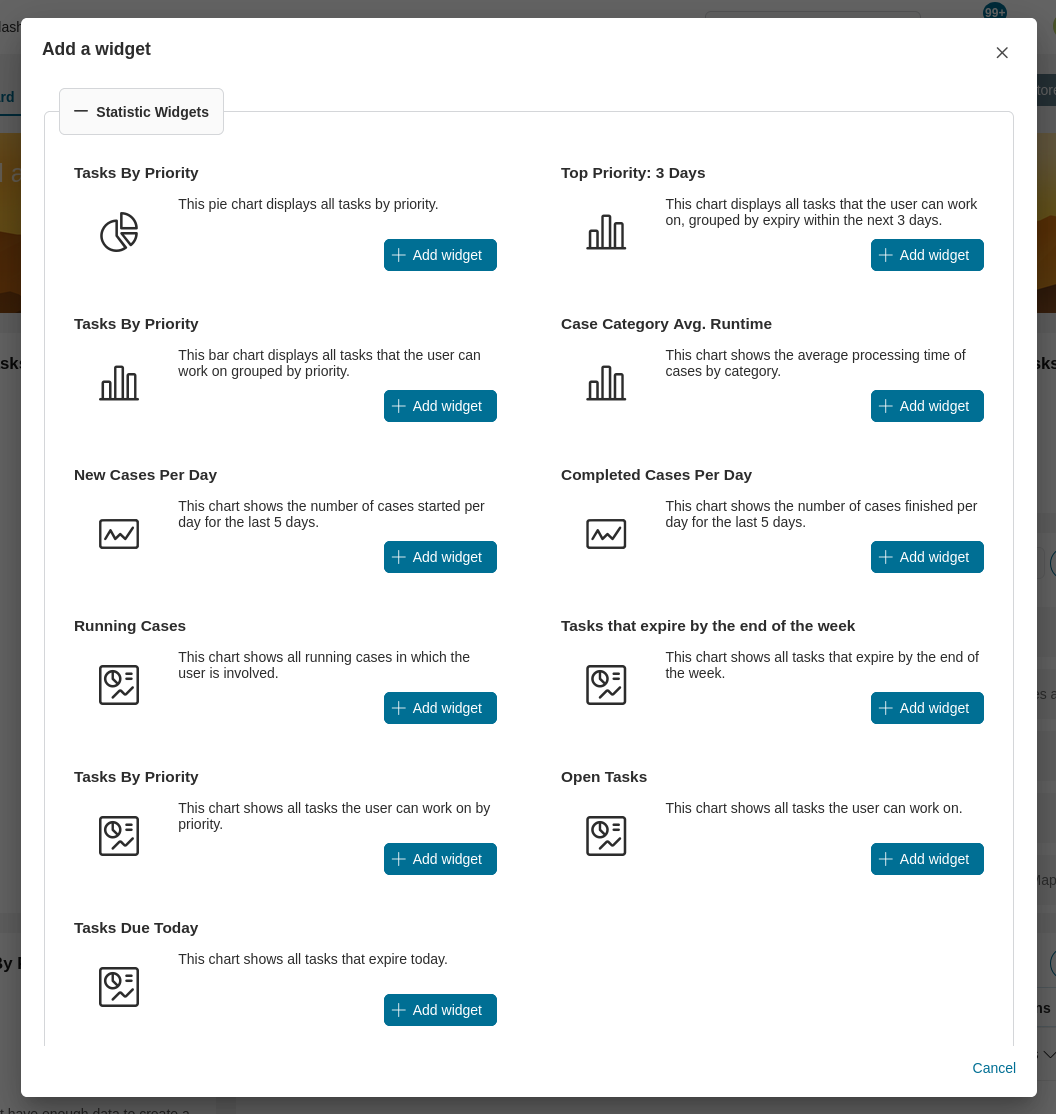
Available Statistic Charts
Task-Related Charts
Tasks By Priority (Pie Chart)
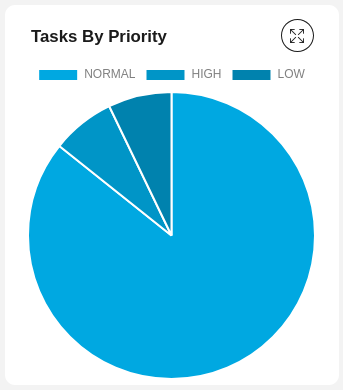
Displays all tasks by priority
Chart type:
Pie
Tasks By Priority (Bar Chart)
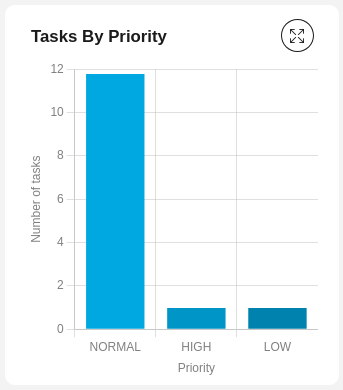
Displays all tasks the user can work on, grouped by priority
Chart type:
Bar
Tasks By Priority (Number)
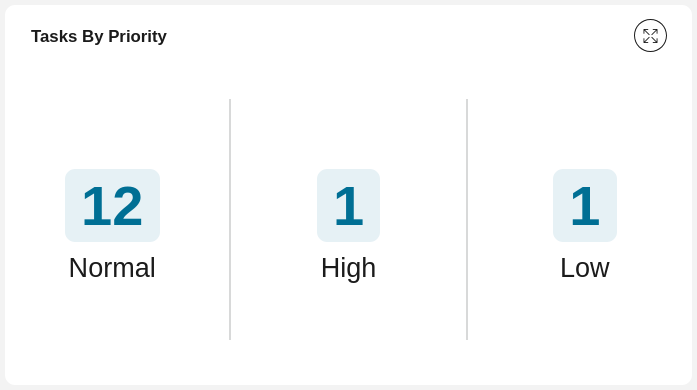
Shows all tasks the user can work on by priority
Chart type:
Number
Top Priority: 3 Days
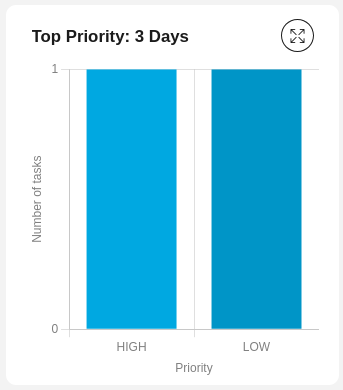
Displays all tasks the user can work on that expire within the next 3 days
Chart type:
Bar
Tasks that Expire by the End of the Week
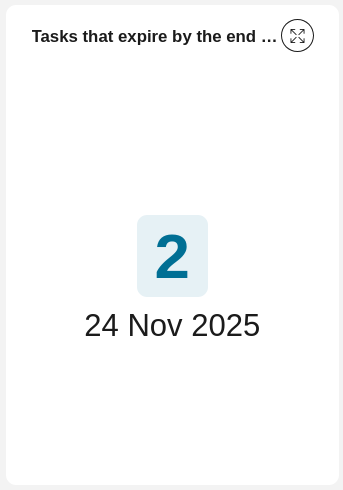
Shows all tasks that expire by the end of the week
Chart type:
Number
Tasks Due Today
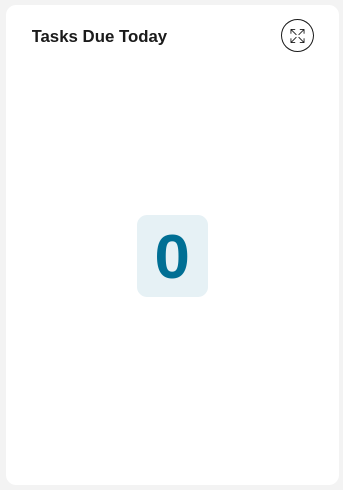
Shows all tasks that are due today
Chart type:
Number
Open Tasks
Shows all tasks the user can work on
Chart type:
Number
Case-Related Charts
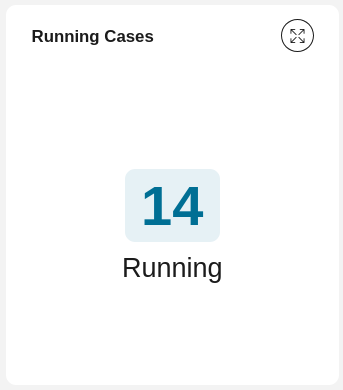
Running Cases
Shows all running cases in which the user is involved
Chart type:
Number
New Cases Per Day
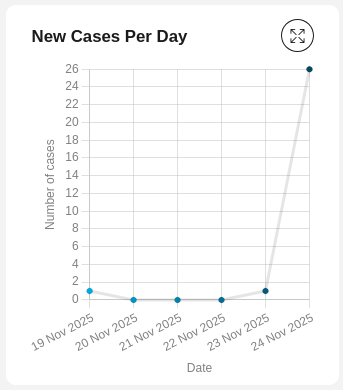
Shows the number of cases started per day for the last 5 days
Chart type:
Line
Completed Cases Per Day
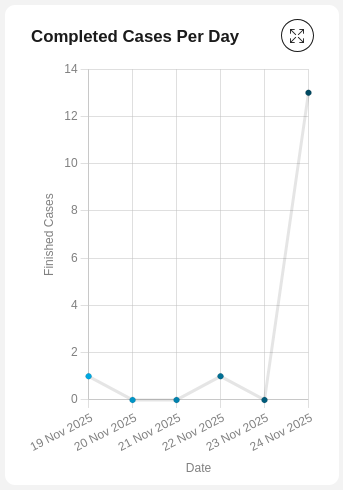
Shows the number of cases finished per day for the last 5 days
Chart type:
Line
Case Category Avg. Runtime
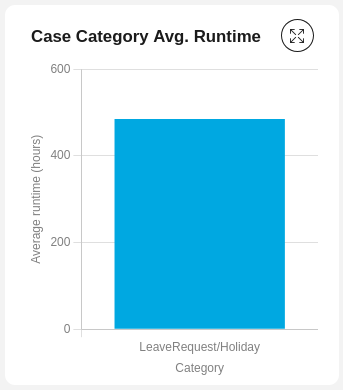
Shows the average processing time of cases by category
Chart type:
Bar